
B-hVSIG4 mice
| Strain Name |
C57BL/6-Vsig4tm3(VSIG4)Bcgen/Bcgen
|
Common Name | B-hVSIG4 mice |
| Background | C57BL/6N | Catalog number | 111035 |
|
Aliases |
CR, CRIg, Z39I, Z39IG | ||
|
NCBI Gene ID |
278180 | ||
mRNA expression analysis

Strain specific analysis of VSIG4 gene expression in wild-type C57BL/6 mice and homozygous B-hVSIG4 mice by RT-PCR. Mouse Vsig4 mRNA was detectable in liver tissue of wild-type C57BL/6 mice (+/+). Human VSIG4 mRNA was detectable only in homozygous B-hVSIG4 mice but not in wild-type mice.
Protein expression analysis
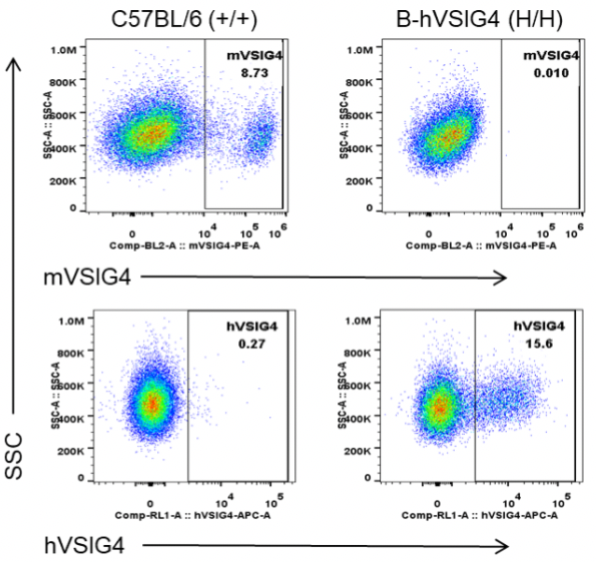
Strain specific VSIG4 expression analysis in wild-type C57BL/6 mice and homozygous B-hVSIG4 mice by flow cytometry. PEMs (peritoneal exudate macrophages) were collected from wild-type C57BL/6 mice (+/+) and homozygous B-hVSIG4 mice (H/H). Mouse VSIG4 was detectable only in wild-type mice. Human VSIG4 was detectable only in homozygous B-hVSIG4 mice (H/H).
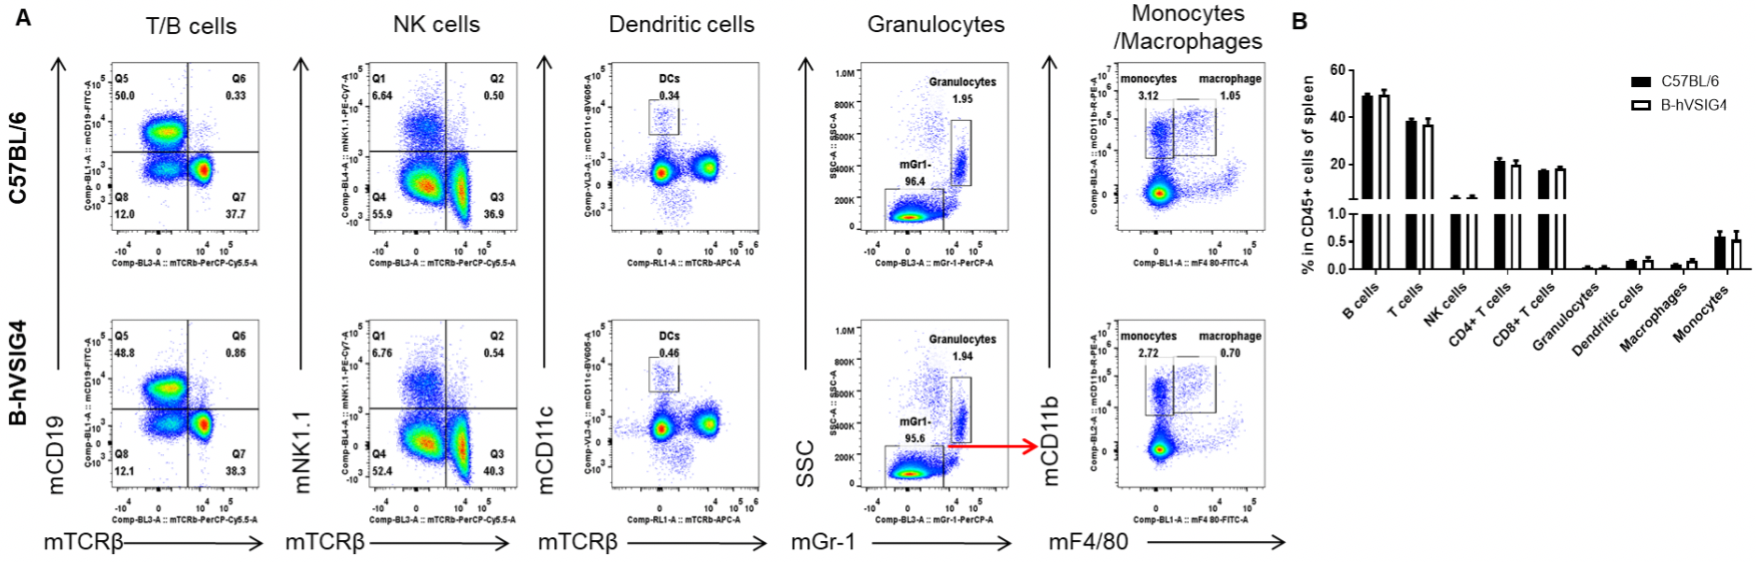
Analysis of spleen leukocyte subpopulations by FACS. Splenocytes were isolated from female C57BL/6 and B-hVSIG4 mice (n=3, 7-week-old). Flow cytometry analysis of the splenocytes was performed to assess leukocyte subpopulations. A. Representative FACS plots. Single live cells were gated for the CD45+ population and used for further analysis as indicated here. B. Results of FACS analysis. Percent of T cells, B cells, NK cells, dendritic cells, granulocytes, monocytes and macrophages in homozygous B-hVSIG4 mice were similar to those in the C57BL/6 mice, demonstrating that VSIG4 humanized does not change the overall development, differentiation or distribution of these cell types in spleen. Values are expressed as mean ± SEM.
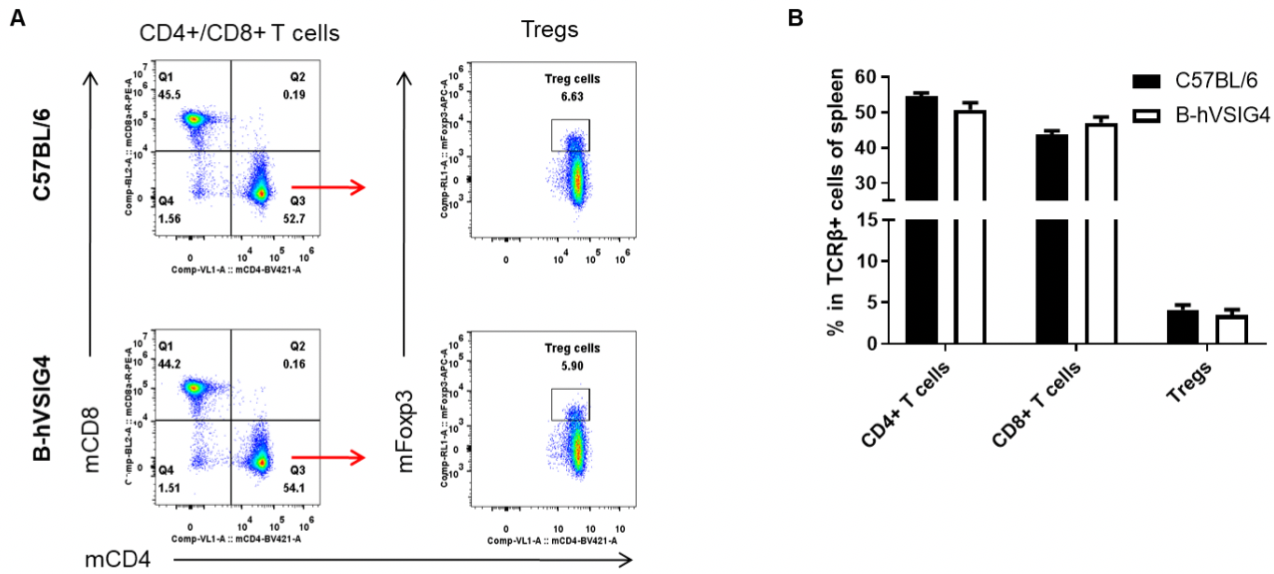
Analysis of spleen T cell subpopulations by FACS. Splenocytes were isolated from female C57BL/6 and B-hVSIG4 mice (n=3, 7-week-old). Flow cytometry analysis of the splenocytes was performed to assess leukocyte subpopulations. A. Representative FACS plots. Single live CD45+ cells were gated for TCRβ+ T cell population and used for further analysis as indicated here. B. Results of FACS analysis. The percent of CD4+ T cells, CD8+ T cells and Tregs in homozygous B-hVSIG4 mice were similar to those in the C57BL/6 mice, demonstrating that introduction of hVSIG4 in place of its mouse counterpart does not change the overall development, differentiation or distribution of these T cell subtypes in spleen. Values are expressed as mean ± SEM.
Analysis of leukocytes cell subpopulation in lymph node
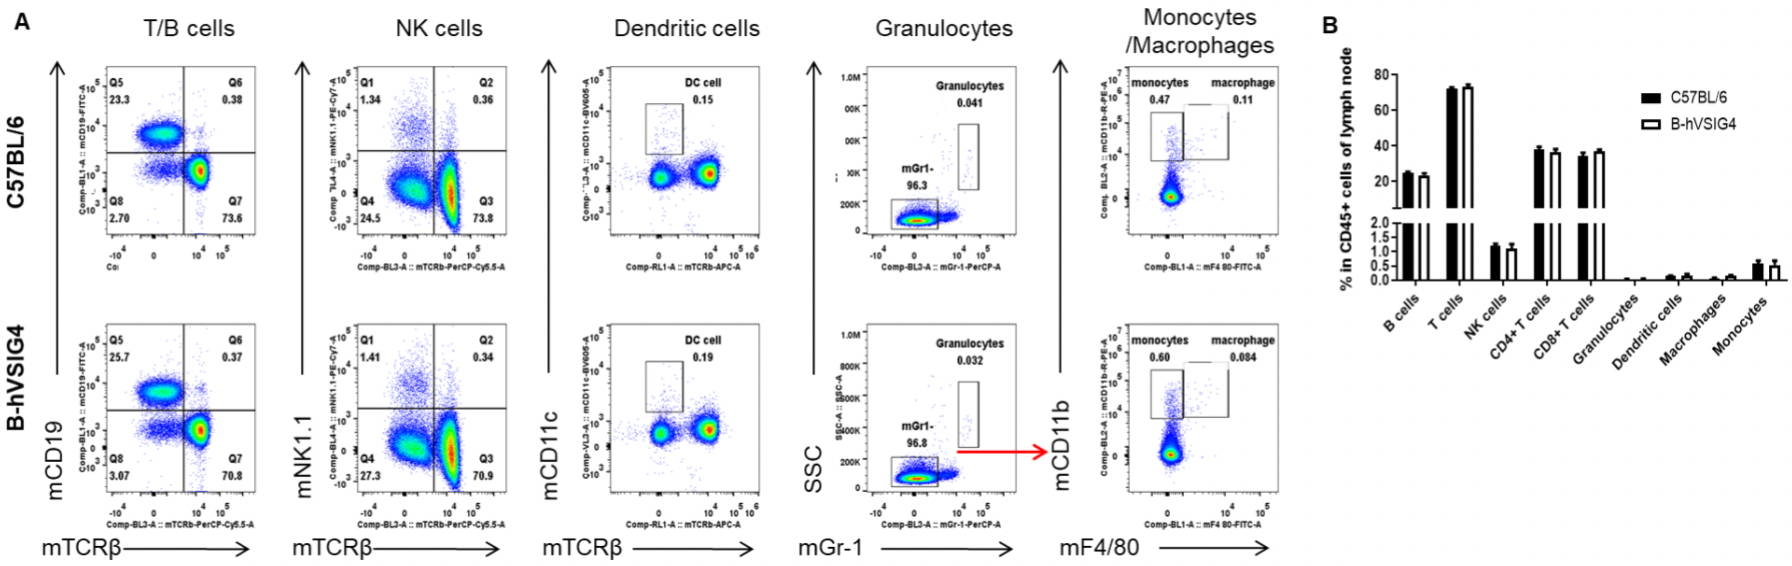
Analysis of lymph node leukocyte subpopulations by FACS. Lymph nodes were isolated from female C57BL/6 and B-hVSIG4 mice (n=3, 7-week-old). Flow cytometry analysis of the leukocytes was performed to assess leukocyte subpopulations. A. Representative FACS plots. Single live cells were gated for the CD45+ population and used for further analysis as indicated here. B. Results of FACS analysis. Percent of T cells, B cells, NK cells, dendritic cells, granulocytes, monocytes and macrophages in homozygous B-hVSIG4 mice were similar to those in the C57BL/6 mice, demonstrating that VSIG4 humanized does not change the overall development, differentiation or distribution of these cell types in lymph node. Values are expressed as mean ± SEM.
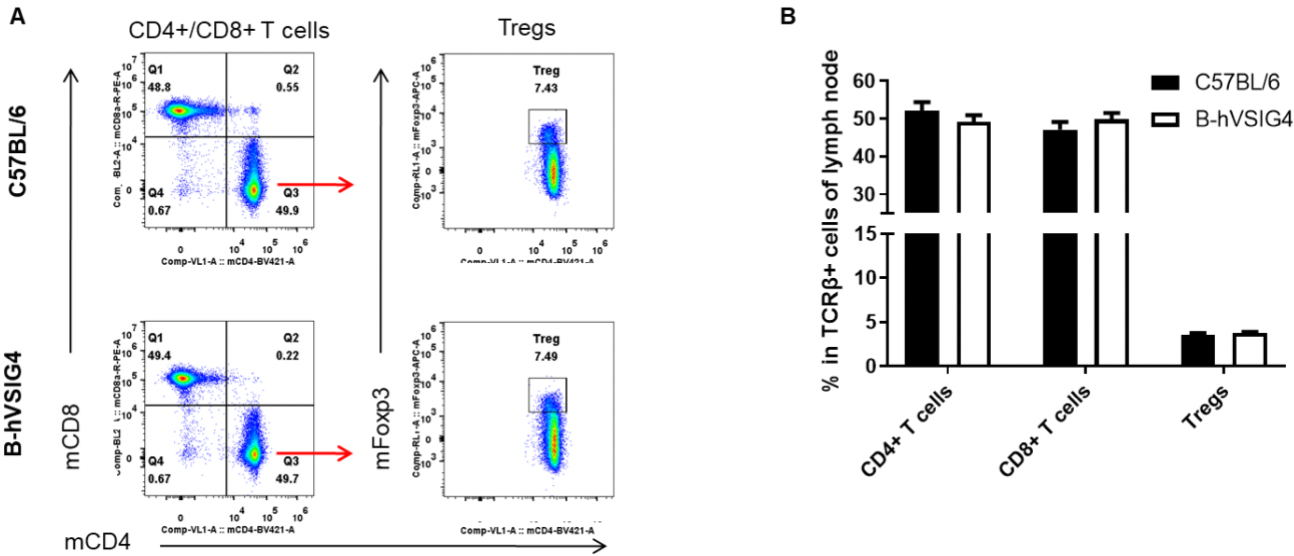
Analysis of lymph node T cell subpopulations by FACS. Leukocytes were isolated from female C57BL/6 and B-hVSIG4 mice (n=3, 7-week-old). Flow cytometry analysis of the leukocytes was performed to assess leukocyte subpopulations. A. Representative FACS plots. Single live CD45+ cells were gated for TCRβ+ T cell population and used for further analysis as indicated here. B. Results of FACS analysis. The percent of CD4+ T cells, CD8+ T cells, and Tregs in homozygous B-hVSIG4 mice were similar to those in the C57BL/6 mice, demonstrating that introduction of hVSIG4 in place of its mouse counterpart does not change the overall development, differentiation or distribution of these T cell subtypes in lymph node. Values are expressed as mean ± SEM.
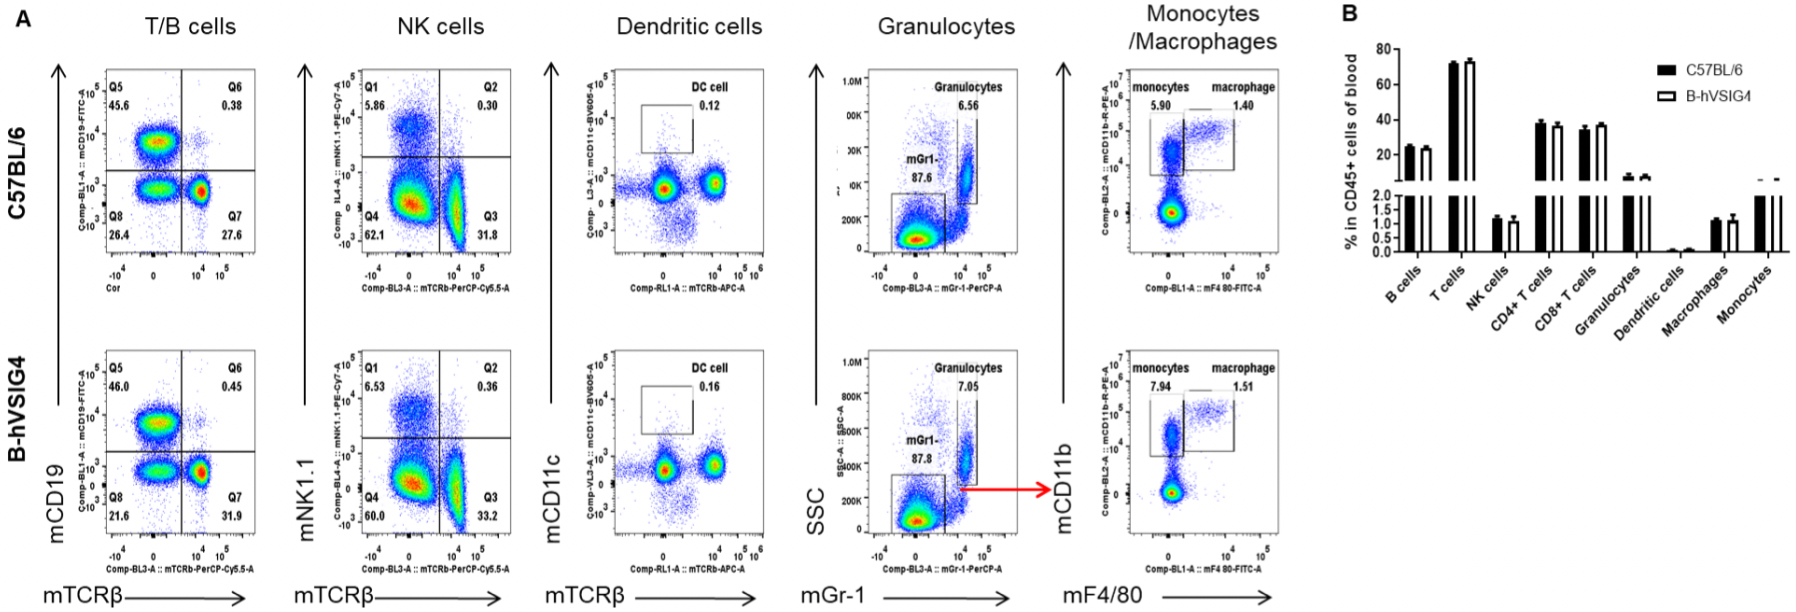
Analysis of blood leukocyte subpopulations by FACS. Blood cells were isolated from female C57BL/6 and B-hVSIG4 mice (n=3, 7-week-old). Flow cytometry analysis of the blood cells was performed to assess leukocyte subpopulations. A. Representative FACS plots. Single live cells were gated for the CD45+ population and used for further analysis as indicated here. B. Results of FACS analysis. Percent of T cells, B cells, NK cells, dendritic cells, granulocytes, monocytes and macrophages in homozygous B-hVSIG4 mice were similar to those in the C57BL/6 mice, demonstrating that VSIG4 humanized does not change the overall development, differentiation or distribution of these cell types in blood. Values are expressed as mean ± SEM.
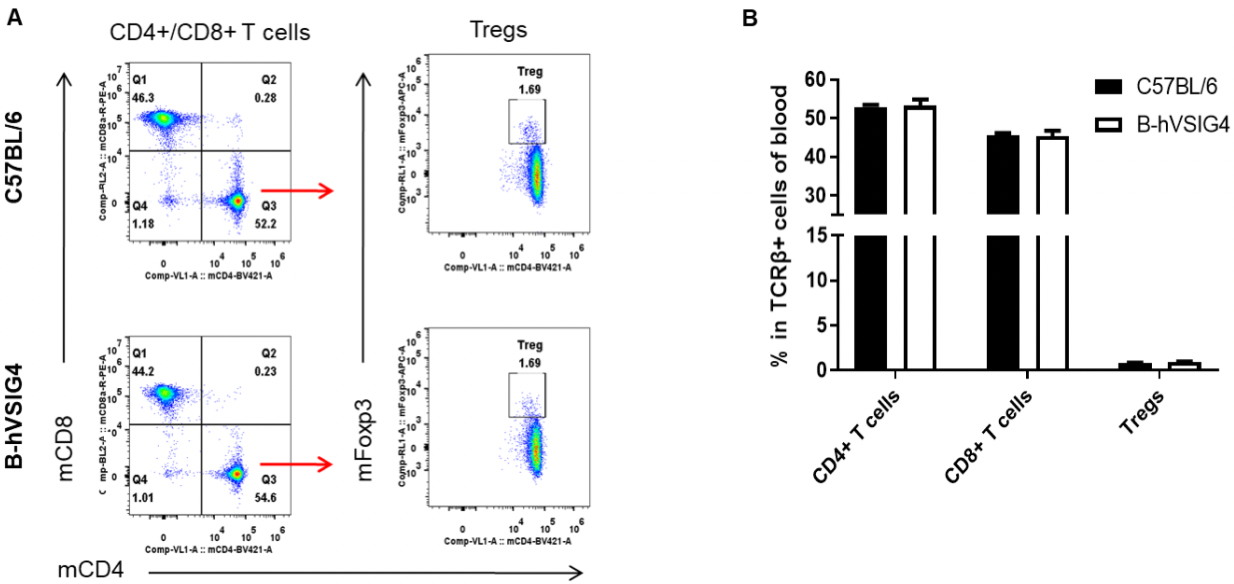
Analysis of blood T cell subpopulations by FACS. Blood cells were isolated from female C57BL/6 and B-hVSIG4 mice (n=3, 7-week-old). Flow cytometry analysis of the blood cells was performed to assess leukocyte subpopulations. A. Representative FACS plots. Single live CD45+ cells were gated for TCRβ+ T cell population and used for further analysis as indicated here. B. Results of FACS analysis. The percent of CD4+ T cells, CD8+ T cells, and Tregs in homozygous B-hVSIG4 mice were similar to those in the C57BL/6 mice, demonstrating that introduction of hVSIG4 in place of its mouse counterpart does not change the overall development, differentiation or distribution of these T cell subtypes in blood. Values are expressed as mean ± SEM.

Antitumor activity of anti-human VSIG4 antibody (hVSIG4 Ab-A, in house) in B-hVSIG4 mice. (A) Anti-human VSIG4 antibody inhibited MC38 tumor growth in B-hVSIG4 mice. Murine colon cancer MC38 cells were subcutaneously implanted into homozygous B-hVSIG4 mice (female, 7-week-old, n=5). Mice were grouped when tumor volume reached approximately 100-150 mm3, at which time they were treated with anti-human VSIG4 antibody indicated in panel. (B) Body weight changes during treatment. As shown in panel A, anti-human VSIG4 antibody was efficacious in controlling tumor growth in B-hVSIG4 mice, demonstrating that the B-hVSIG4 mice provide a powerful preclinical model for in vivo evaluation of anti-human VSIG4 antibodies. Values are expressed as mean ± SEM.

Flow cytometry analysis of tumor infiltrating lymphocytes (TILs). Tumor cells were harvested at the endpoint of experiment (n=5). Flow cytometry analysis of the lymphocytes were performed to assess cell number and proportion changes compared to the group treated with isotype antibody. Percentages of CD8+ T cells, CD4+ T cells, Tregs, M1 macrophages and M1/M2 ratio were increased, while percentages of MDSCs and M2 macrophages were decreased in the group treated with anti-VSIG4 antibody compared to the isotype antibody treated group. Values are expressed as mean ± SEM.


+86-010-56967680


010-56967601

ir@bbctg.com.cn
Copyright © 2024 Biocytogen. All Rights Reserved
Powered by Fractal-technology